Exposure Analytics launches benchmark on real-world event engagement
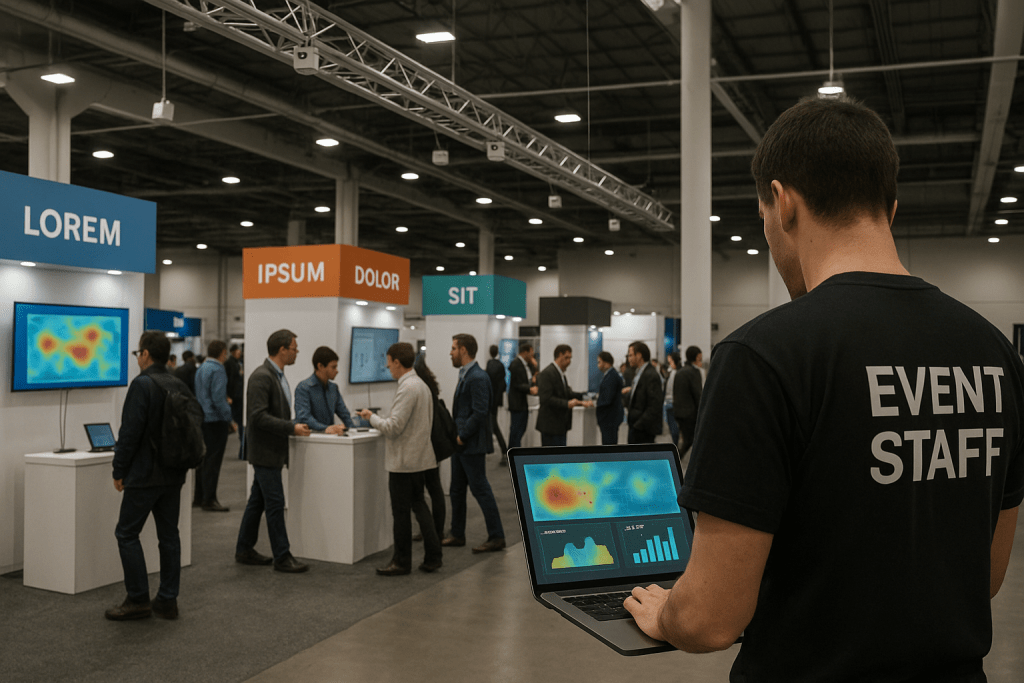
Exposure Analytics has released a data-led benchmark designed to help organisers and exhibitors move beyond basic attendance figures and understand how people actually interact with physical event spaces. The company’s Physical Engagement Index draws on anonymised sensor data from 43.8 million visitors across 3,000 events between 2020 and 2026, providing comparative insight into how effectively stands, activations and show floors are performing.
Background and industry context
For more than a decade, event performance has typically been measured using headline metrics such as registrations, badge scans and footfall. While these numbers indicate how many people attended or passed a stand, they reveal little about whether visitors paid attention, engaged with content or were influenced by the experience.
At the same time, physical events have increasingly been expected to demonstrate return on investment in ways that can be benchmarked against digital marketing channels. Organisers, exhibitors and sponsors are under growing pressure to justify spend with evidence that goes beyond counting bodies through a gate.
Developments in sensor technology and Wi-Fi/Bluetooth tracking have opened the door to more sophisticated measurement of movement and dwell patterns in venues. Vendors in this space have focused on using anonymised signals from devices and people to understand how long visitors stay in particular zones, how they flow through a show floor and which assets or experiences hold attention.
Exposure Analytics operates within this measurement segment, deploying sensors across trade shows, exhibitions, conferences and brand activations. By aggregating multi-year data from these deployments, the company is now looking to give event stakeholders a broader view of what “good” engagement looks like across different types and scales of events.
Key developments in the Physical Engagement Index
The Physical Engagement Index is presented as a consolidated report built from live deployments at around 3,000 events, covering a measured audience of 43.8 million visitors between 2020 and 2026. Rather than focusing on unique technology features, the initiative is positioned as a benchmarking framework that emphasises dwell and engagement time over simple footfall statistics.
The index uses anonymised sensor data to assess how long visitors remain within defined areas, and how they behave in relation to specific stands or experiences. Metrics typically include:
- Dwell time: how long visitors stay in proximity to a stand or activation.
- Engagement depth: repeat visits or extended presence indicating stronger interest.
- Flow patterns: how attendees move towards, through and away from key zones.
By structuring these metrics into an index, Exposure Analytics aims to allow event stakeholders to compare the performance of individual stands or shows against anonymised benchmarks from similar environments. The time window from 2020 to 2026 captures activity across a period of major disruption and recovery for the events sector, including phases of reduced capacity, hybrid formats and a return to large-scale in-person gatherings.
In discussions around the report, Exposure Analytics representatives highlight the limitations of relying solely on badge scans and raw visitor counts. A busy aisle does not necessarily mean a successful stand, and a high number of scans may simply reflect a competition mechanic or giveaway rather than meaningful interaction. The index instead focuses on measures that signal genuine attention and interest, such as visitors staying to watch a demonstration or spending extended time with staff.
Industry impact and use cases
The introduction of the Physical Engagement Index is likely to influence how both organisers and exhibitors plan and evaluate their activities. For organisers, the aggregated data can inform decisions around floorplan design, traffic management and feature placement. Understanding where visitors naturally cluster, where they hesitate and where they pass quickly can help to optimise layouts for engagement rather than just circulation.
For exhibitors and sponsors, the index provides a reference point for evaluating stand design, staffing and content strategies. Instead of relying on anecdotal feedback or on-the-day impressions, teams can use engagement metrics to assess whether changes in messaging, interactivity or layout are having a measurable effect on visitor behaviour.
Vendors delivering experiential builds, brand activations and sponsorship packages can also use the benchmarks to demonstrate performance to clients. Anonymous comparative data from similar activations or events allows agencies to position results in context, moving conversations away from subjective opinions and toward data-based evaluation.
Anonymisation is central to the approach, with the system tracking behaviour patterns without capturing personally identifiable information. This is important not only from a compliance perspective, but also in making the index suitable for use across multiple regions, venues and event formats where privacy expectations and regulations differ.
Why this matters for event professionals and technology providers
For event professionals, the shift from counting visitors to measuring engagement changes how success is defined and communicated. Registration and attendance remain important, but they no longer tell the full story about whether an event is achieving its objectives. The Physical Engagement Index reflects a broader trend of treating in-person experiences with the same analytical rigour applied to websites, apps and digital campaigns.
Event marketers and sales leaders can use these insights to refine audience acquisition strategies, tailoring content and onsite experiences to the behaviours observed rather than assumptions. If data shows that a particular type of feature area consistently drives deeper engagement, organisers can prioritise similar elements in future editions.
Technology providers in the event space, including registration platforms, mobile app developers and lead capture solutions, may find opportunities to integrate or align with physical engagement metrics. Combining behavioural data from the show floor with session attendance, lead quality and post-event follow-up could yield a more complete view of the attendee journey.
The index also raises expectations around reporting. Exhibitors increasingly want dashboards that move beyond top-line numbers and show how their investment translated into visitor attention, conversations and potential pipeline. Measurement providers who can connect physical engagement with commercial outcomes are likely to be in stronger demand.
Conclusion
The launch of Exposure Analytics’ Physical Engagement Index underscores a maturing approach to data in the events industry. By aggregating anonymised sensor data from tens of millions of visitors across thousands of events, the company is attempting to establish a standardised view of what meaningful engagement looks like in physical environments.
While traditional metrics such as footfall and badge scans will continue to play a role, the focus is shifting towards understanding how long visitors stay, where they choose to spend their time and which experiences hold their attention. For organisers, exhibitors and their technology partners, this evolution offers the potential for more informed decision-making, more accountable spending and event formats that are better aligned with audience behaviour.
As the sector continues to balance in-person, hybrid and digital formats, frameworks like the Physical Engagement Index are likely to become an important part of how event performance is planned, compared and improved over time.